DendrogramStatistics
- class visualize.dendrogram.DendrogramStatistics(cell)
Bases:
DendrogramPlot dendrogram statistics.
This class creates a composite plot of a dendrogram, as well as dendritic length and synapse count statistics. These statistics include:
The total amount of dendritic length in a certain bin of soma distance.
The total amount of synapses in a certain bin of soma distance.
The total amount of synapses per micron dendritic length.
Example:
>>> d = DendrogramStatistics(cell)
>>> fig = d.plot()
>>> plt.show()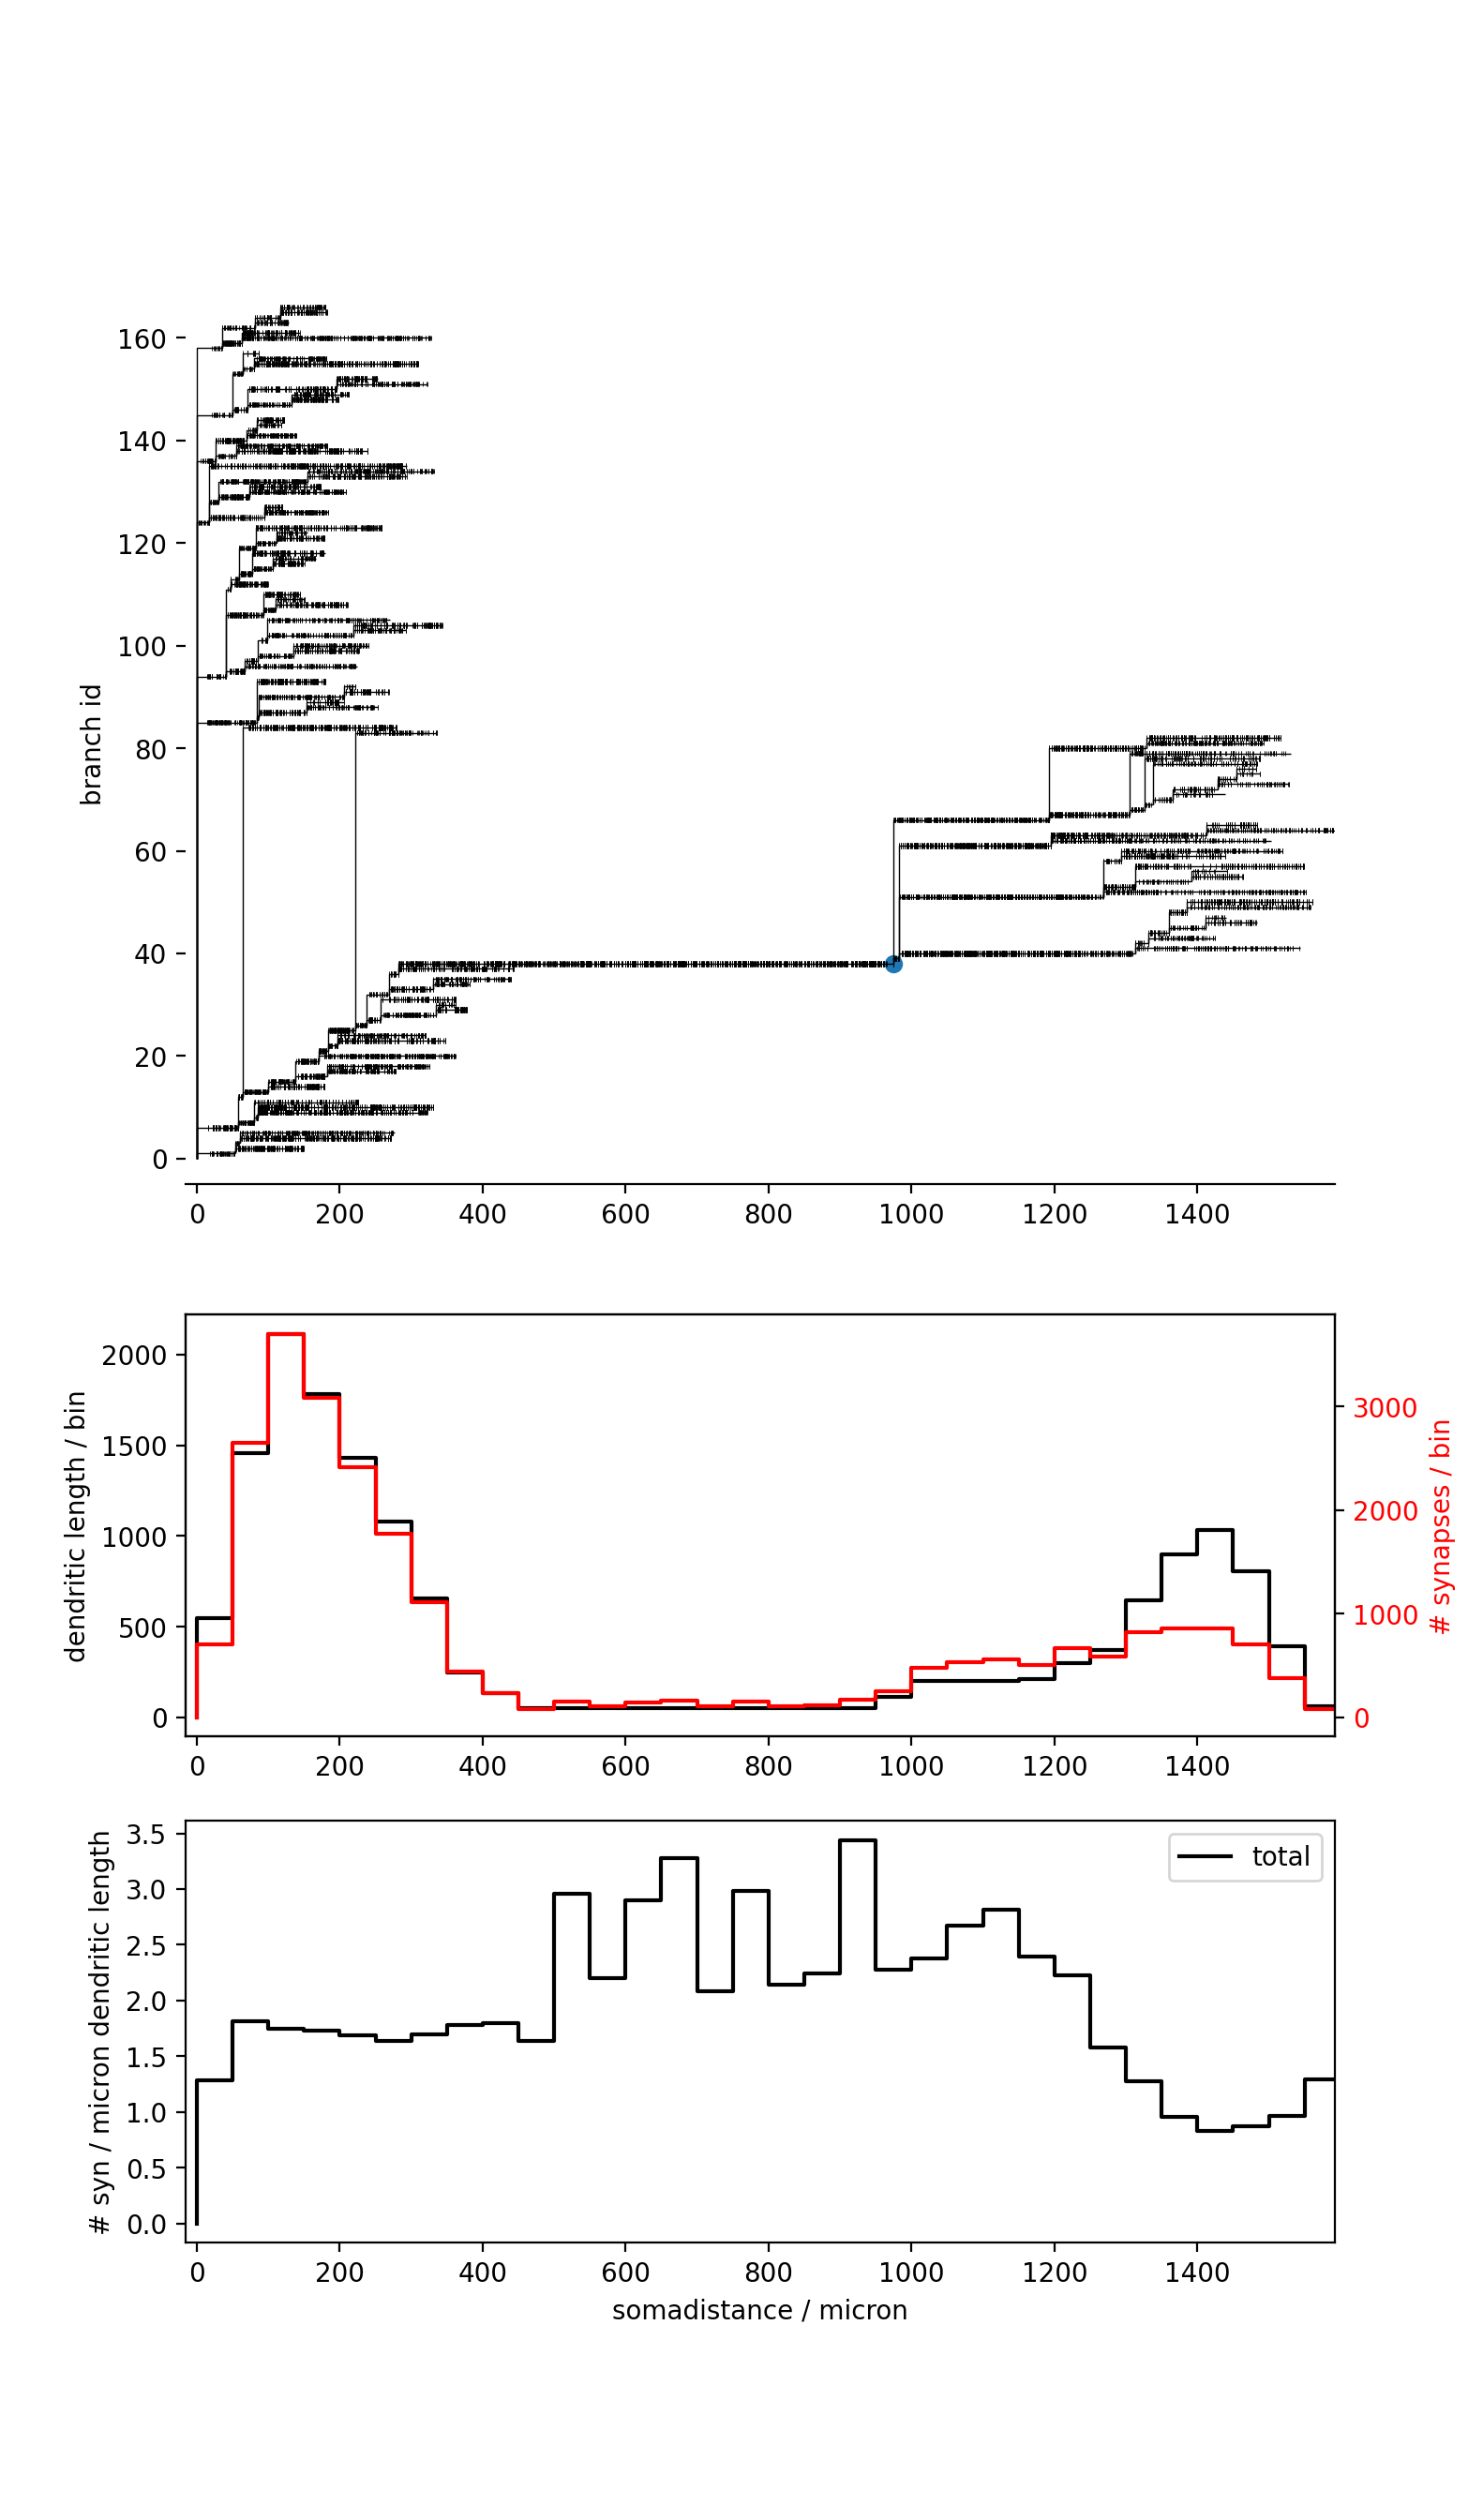
plot(figsize, colormap_synapses)Plot the dendrogram statistics.
Documentation unclear, incomplete, broken or wrong? Let us know